
Monday 15 October had a lot of people eagerly awaiting the postman to deliver the result of the London Marathon ballot – the lottery by which approximately half of race places are made available to the public. Unfortunately, the majority of applicants will have been left disappointed by the outcome: a record number of people applied for the limited number of places available. I wrote about the ballot process three years ago, and since then the London Marathon has only increased in popularity.
For 2019’s race, a staggering 414,168 people applied to take part, increasing again from the 386,050 who applied for the 2018 race. Each year approximately 17,500 places are available through the ballot, which implies the probability of obtaining a place has continued to dip since 2016’s race, from 6.9% to 4.2%. Unsuccessful applications outnumber successful ones by nearly 24:1. If you had applied every year for the last three years, your chance of getting to run at least once would be just 15.7% – around 1 in 6.
TABLE 1 Number of ballot places and applicants for the London marathon (2014 to 2019).
| Year of race | 2015 | 2016 | 2017 | 2018 | 2019 |
| Ballot places | 17,000 | 17,000 | ~17,500 | ~17,500 | ~17,500 |
| Ballot entries | 125,000 | 247,069 | 253,930 | 386,050 | 414,168 |
| Probability of success | 13.6% | 6.9% | 6.9% | 4.5% | 4.2% |
| Number of rejected applicants per place | 7.4 | 14.5 | 14.5 | 22.2 | 23.8 |
Has it always been this hard to take part in the marathon? The simple answer is no. The London Marathon started in 1981, with 20,000 applicants for the 7,000 or so places. In its second year the number of places more than doubled to 16,350, and the numbers starting the race have increased steadily ever since – reaching a high of 41,103 in 2018. More interesting has been the growth in applicant numbers. These were broadly stable until around 1997, at which point numbers increased steadily until 2008. Since then, applicant numbers have grown exponentially. Had the number of ballot applicants in 2015 not been capped at 125,000, we could reasonably have expected the curve in Figure 1 to bend upwards more smoothly.
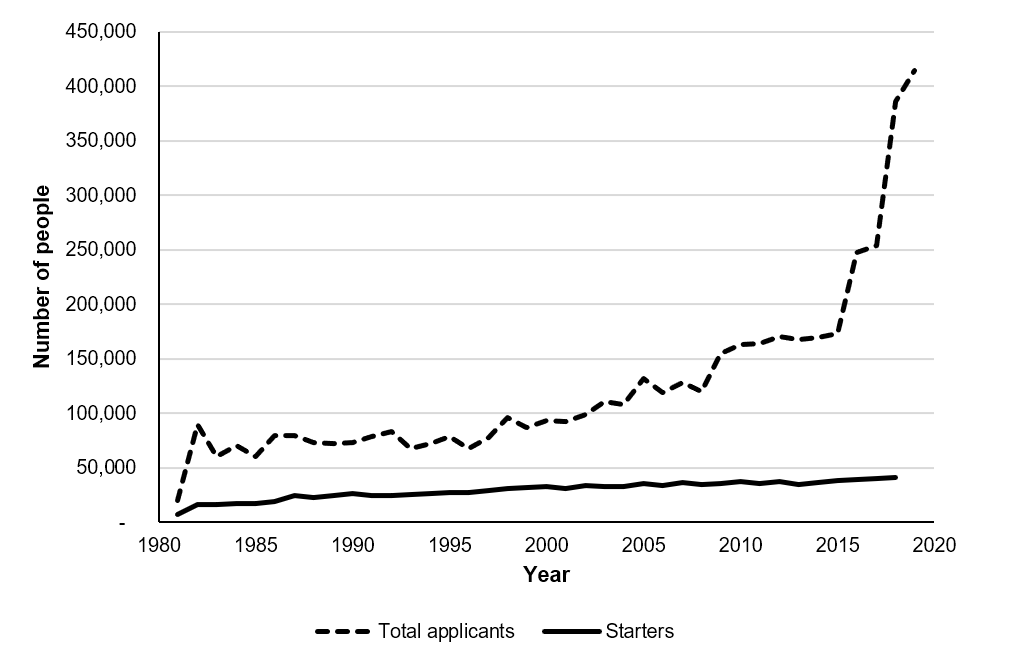
FIGURE 1 Number of applicants and starters of the London Marathon since its inception. Applicants include ballot entrants, plus all other mechanisms for entry.
What has happened since 2008 to cause such a surge in popularity? Inspiring performances from UK athletes do not appear to be the reason. Paula Radcliffe’s record-breaking run was in 2003, yet there was a fall in applications for the following year’s race. And while 2008 was an Olympic year, the games took place after the ballot application process. The only potential explanation I can find is that in 2009 the ballot moved online. Prior to this, applicants were required to find the somewhat obscure Marathon News magazine and post in the entry form. Applying online made the process easier and therefore appears to be the likely culprit for the start of this exponential rise in applicant numbers.
But there is no similarly clear or convincing reason for the spike in popularity in 2015. It may be that the growth of community “parkrun” events has increased the number of runners, or that the rising status of the London Marathon over time (with prolific coverage on the BBC) has resulted in the numbers increasing. The London Marathon has also become very adept at maximising attention, being a founding member of the World Marathon Majors (a series of six of the most prestigious marathons), securing Mo Farah (a global star) to make his debut at the event, and ensuring that each year the races contain world-leading talent. For instance, in 2018 the London Marathon winner was Eliud Kipchoge – Olympic Gold Medallist, and now world-record holder (thanks to his performance at the Berlin Marathon, another of the Majors).
In order to meet the increasing demand for places, the marathon has changed over time. The course route has been adapted slightly to be more accommodating, and for the first time this year, “waves” were introduced. By setting groups off in staggered intervals, runners can be spread more evenly over the course. The advantage of this staggered approach is best described using the modal (most common) completion time, as opposed to the mean or median, which are otherwise in much more widespread use. A slight delay between setting off each of 10 starting groups (based on expected time) allows the modal peak – the bulk of people who are likely to finish the course in 4 to 4.5 hours – to be spread over a slightly longer period.
Fundamentally, with events such as marathons, resources at any given point are limited (e.g. number of first aiders, width of the roads, and volunteers to hand runners their bags at the finish). Spreading the peak out in this way thus reduces the pressure on race resources and allows more people to run safely. However, the increase in runners allowable by such a method is small (certainly fewer than 10% extra), but it shows how capacity is likely reached for the event, and how the “marginal gains” attitude has made its way into event planning.
These types of changes to systems are covered in the field of operational research (OR), a statistics-heavy mathematics discipline which involves analysis and specification of systems to maximise throughput. Famous examples of systems that have been optimised using OR techniques include the Suez Canal (which is run one-way to maximise throughput, rather than have ships crossing on an ad hoc basis), and Terminal 5 at Heathrow Airport (passengers were simulated to establish optimum staff levels and check-in desks to satisfy queueing standards).
The increase in London Marathon applicants has also led to a squeeze of the entry system for 2019’s race. First, the number of places available to running clubs (the foundation of the UK athletics system) has roughly halved. Second, there has also been a change in the way the “good for age” automatic places are assigned. Previously, you needed to hit a common standard of performance to be included in the race. Now, the number of automatic entrants is constrained to the fastest 3,000 runners who can beat age- and gender-specific targets (set by the London Marathon). This is similar to how the Boston Marathon has worked for some time.
Under this system, we are likely to also see the implicit standard tighten over the coming years, as with a fixed field size – as opposed to an automatic qualification time – runners are effectively competing for places. As an example, for the 2019 Boston Marathon, runners needed to be 4 minutes 52 seconds faster than the qualifying standard; this meant a time of 3:00.08 for a male aged 18-34, and 3:30.08 for a female aged 18-34.
In 2015, I concluded that all marathons were the same distance, and so unsuccessful applicants should consider other marathons besides London. This conclusion has become even more true as the odds of a ballot place lengthen further. If marathons are of interest to you, run them, enjoy them, and by all means enter the London Marathon ballot. One day, maybe you’ll be one of the lucky ones.
About the author
Anthony Hatswell is a health economist, statistician and runner. He is director of the consultancy Delta Hat, who work in evidence-based medicine.


