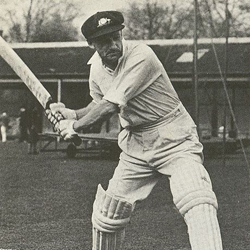

In the 137 years of test cricket no one has a batting average remotely close to Bradman’s. His career batting average is almost 39 runs higher than the next batsman (who have batted more than 20 times) and Bradman scored a century every 2.75 innings.
But just how good was Bradman’s sporting performance? How does his performance compare to other test cricket batsmen and legendary figures in other sports?
To answer this, I investigated Bradman’s performance and compared it with other cricketers and sports, such as golf, football, tennis, Formula 1 motor racing and rugby union. I did this using a variety of summary statistics including the number of standard deviations that they stand above the mean for their sport – the Z score statistic. This is defined as:
Z-score = (individual’s performance – mean performance for sport)/Standard deviation for sport
The graph below shows the runs Bradman scored in each innings and his cumulative batting average over his 80 test innings career. It also shows that by the end of his 13 test innings Bradman was averaging nearly 100 runs per innings.
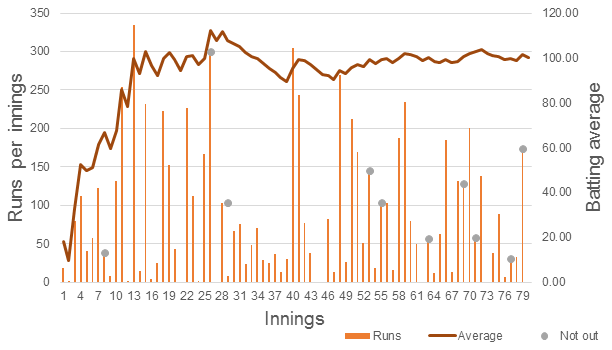
Bradman runs per innings and batting average over his 80 innings test career from 1927 to 1948
Throughout the rest of his test career, except for his 39th innings (in 1934) his batting average never dipped below 90. Even during the controversial ‘Bodyline tour’ by England of Australia in 1932-33 (innings 27 to 34) his career batting average was over 100 and only dipped below this benchmark in the last innings of that series.
The dot plot below shows the distribution of the test batting average of the 274 batsman (as of February 2014) who have scored over 2,000 runs in test cricket.
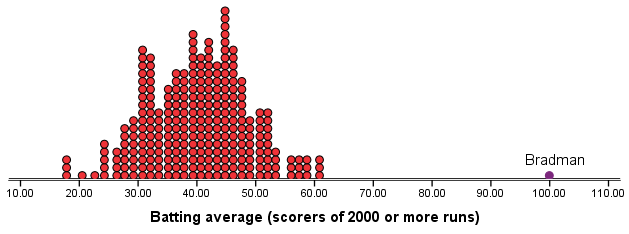
Dot plot of batting average for scorers of 2,000 or more test runs (as of February 2014)
This distribution is reasonably symmetric, but what clearly stands out is Bradman’s performance. His career batting average is almost 39 runs higher than the next batsman who have scored more than 2,000 runs. For these batsmen the mean test batting average was 40.42 with a standard deviation of 9.19. This gives Bradman’s batting average of 99.94 a Z-score of 6.481.
If we only select the best test batsman, as a comparator, those with a career batting average of over 50 who have scored 1,000 or more runs, then Bradman’s Z-score drops to around 5.4.
I also compared Bradman’s standardised sporting performance to that of several other prominent sports people by comparing the number of standard deviations that they stand above the mean for their sport. This includes sports such as golf, football, tennis, Formula 1 and rugby union.
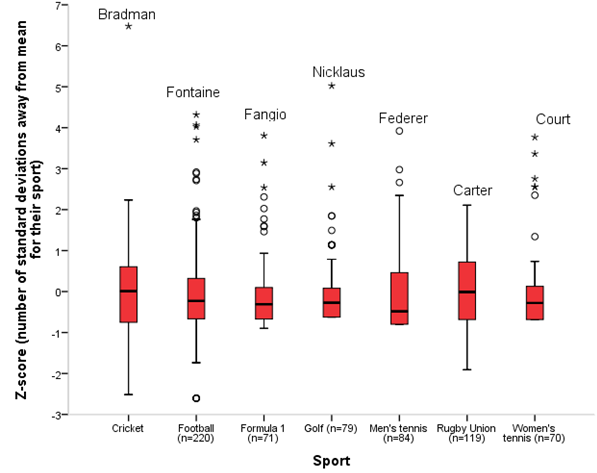
Box and whisker plot of Z-scores for seven sports
| Athlete | Sport | Statistics | Comparator | Z-score |
|
Don Bradman (Australia) | Test Cricket | Batting average |
Batsmen with 2000 runs or more | 6.48 |
|
Jack Nicklaus (USA) | Golf | Major Wins |
Players with 2 or more Major wins | 5.02 |
|
Just Fontaine (France) | Football | Goals per game |
Scorers of 30 or more international goals | 4.32 |
|
Roger Federer (Switzerland) | Tennis (Mens) | Grand Slam wins |
Players with 2 or more Grand Slam wins | 3.92 |
|
Margaret Court (Australia) | Tennis (Womens) | Grand Slam wins |
Players with 2 or more Grand Slam wins | 3.77 |
|
Juan Manuel Fangio (Argentina) | Formula 1 | Races per win |
Drivers with two or more Grand Prix win | 3.81 |
|
Dan Carter (New Zealand) | Rugby Union | Points per game |
Players with 200 or more points | 2.08 |
Statistics for several prominent sportspeople by comparing the number of standard deviations that they stand above the mean for their sport
The American golfer Jack Nicklaus’s performance as the winner of 18 major golf tournaments (Z-score of 5.02) of those golfers with two or more major wins is also impressive. But again Bradman’s performance stands out from the crowd.
Bradman was out for zero in his last (80th) innings. If he had scored four more runs in this final innings he would have finished his career with a batting average of 100. No other player who has played more than 20 test match innings has finished with a batting average of more than 61. Bradman's total of 12 test double hundreds is the most achieved by any batsman.
Bradman’s Z-score is superior to several other sporting legends. No other athlete dominates an international sport to the extent that Bradman does test cricket. I have only looked at major sports which I am familiar with. But a similar analysis could be performed on other sports such as baseball or basketball to see if anybody can beat Bradman’s outstanding performance.
Footnotes
- 1. Bradman’s Z score: (99.94 – 40.42)/9.19 = 6.48.
-
Final note: Sometimes outlying values are due to errors in the measurement or recording of the data. Although for sporting performance statistics such as test match batting averages this is unlikely to be the case. There is no formal statistical definition of what constitutes an outlier – determining whether or not an observation is an outlier is ultimately a subjective exercise. The data has not been subjected to a formal or sophisticated statistical analysis and has used simple graphical analysis to show outlying sporting performances. There are more formal statistical tests, such as Grubbs' test for outliers which could be applied such as:
Grubbs, Frank (1950), Sample Criteria for Testing Outlying Observations, Annals of Mathematical Statistics, 21(1) pp. 27-58.
Grubbs, Frank (February 1969), Procedures for Detecting Outlying Observations in Samples, Technometrics, 11(1), pp. 1-21.


