

Early in 2020 the 45th President of the United States Donald J. Trump looked forward to the coming election. A billionaire property developer who had acceded to the presidency after a surprise win in 2016, he anticipated winning his second election as most sitting first-term presidents do. Then the pandemic happened.
In a remarkable 3 November election in which earlier postal votes played an unprecedented role, President Trump’s on-the-day lead was worn away as the postal votes were laboriously counted. Despite repeated legal challenges, the individual states certified their votes one-by-one and Joseph R. Biden won the Electoral College when it met in December 2020.
Billions of dollars had been spent, modellers had predicted, bookies had taken bets, pollsters had polled. Which of them had predicted the outcome and how far out had they done so? This article sets out to answer that question, by analysing the performance of pollsters, seat and vote modellers, and betting firms all the way up to election day 2020.
Assessment
To assess the performances of predictors, we convert all predictions made to a two-party-forced format, meaning that the predictions for undecided voters, “don’t knows”, and third-party and independent candidates will be proportionally reallocated to the official Democratic and Republican candidates for president. Then, to judge the accuracy of a prediction, we use two metrics: Mean Absolute Error (MAE) and WIN (a metric that scores a prediction on whether or not it predicted the eventual winner).
For a fuller discussion of two-party-forced format, our metrics and our choice of predictors, see our article on the 2016 US presidential election.
The results
The counting of votes is depicted in fiction as a simple process, but in reality it is more complicated. In normal elections, as the days progress, small errors are found or a recount changes the vote slightly. It is rare for these changes to make a difference to the final outcome, but it does introduce a slight error. Consequently, even reputable media sources may disagree as to the exact number of popular votes a candidate receives, or the number of digits needed after the decimal point, so the normal process for statistical purposes is to wait until an electoral commission or a legislative body publishes the exact numbers in one document. In the US such a body would be the Federal Electoral Commission.
However, the 2020 election was not a normal election. The repeated questioning of the votes and the repeated requests by President Trump and other associated bodies for recounts meant that keeping a running total of the votes as they were counted was unusually difficult. Although the Electoral College votes were known and fixed, sources for the total popular votes disagreed and I could not find two definitive single sources that agreed on the percentage to two decimal places (see Appendix 4e in the PDF version of this article). Consequently, I had to wait until the Federal Election Commission issued the official figures, which are given in Table 1 to one decimal place.
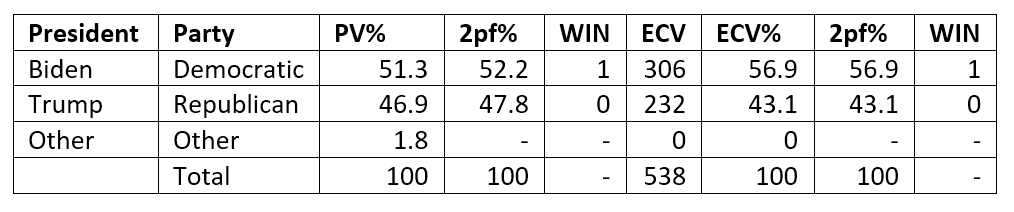
The popular vote shares (PV%) and Electoral College votes (ECV) are presented alongside the two-party-forced (2pf) versions of the results, while the WIN parameter designates the winner and the post-facto probability of success.
Table 1: Results of the 2020 US presidential election.
How well did our predictors do?
Nationwide opinion polls
The website FiveThirtyEight lists 87 distinct entities that conducted, commissioned, or published nationwide opinion polls for the 2020 presidential election.
To match our previous article on the 2016 election, we selected the following:
- ABC News/Washington Post
- CNN
- Rasmussen
- Reuters
- NBC News
The selections were predictors of popular vote. The resulting MAEs and WINs are given in Table 2. If a predictor issues two or more predictions for a given day then we will take just one or take an average for that day.
Table 2: National opinion polls of the popular vote close to the 2020 presidential election. PV = prediction of popular vote; 2pf = prediction of the popular vote on two-party-forced basis; Res = actual result on two-party basis; B = Biden; T = Trump.
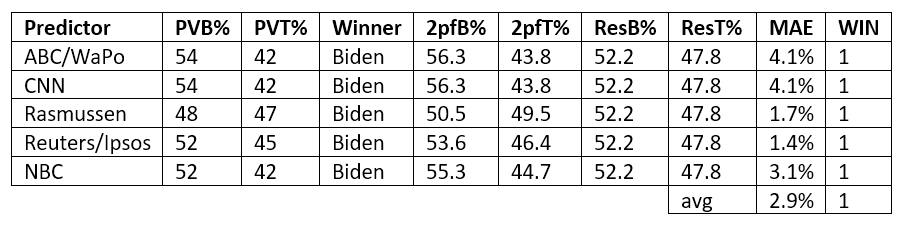
In terms of predicting a popular vote winner, our five selections were large by the standards of past POTUS elections (see PDF Appendix 11-13), although all of them predicted the eventual winner. Note, however, that four out of the five overestimated Biden’s lead.
Modellers and other predictors: Journal national predictions
In October 2020, the online version of PS: Political Science and Politics (Volume 54, issue 1) listed various predictors of the national popular vote and/or electoral vote. Combined with the author’s own searches, that yielded 16 predictors in total.
To match our previous article on the 2016 election, we selected the following predictions by:
- Abramowitz
- Erikson and Wlezien
- Enns and Lagodny (instead of Ray Fair, who declined to predict, stating that his model “…has nothing to say about the effects of pandemics”, although he occasionally updated his outputs. Enns and Lagodny is not an exact match, but their model had an economic component)
- Norpoth
- FiveThirtyEight/Silver
The selections were predictors of popular vote and of Electoral College vote. The resulting MAEs and WINs are given in Tables 3 and 4.
Table 3: Journal predictions of the Electoral College vote close to the 2020 presidential election. ECV = prediction of Electoral College vote; 2pf = prediction of the Electoral College vote on two-party-forced basis; Res = actual result on two-party basis; B = Biden; T = Trump; O = Other.
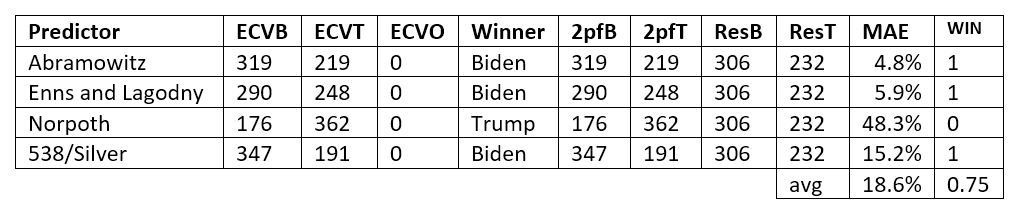
Table 4: Journal predictions of the popular vote close to the 2020 presidential election. PV = prediction of popular vote; 2pf = prediction of the popular vote on two-party-forced basis; Res = actual result on two-party basis; B = Biden; T = Trump; O = Other.
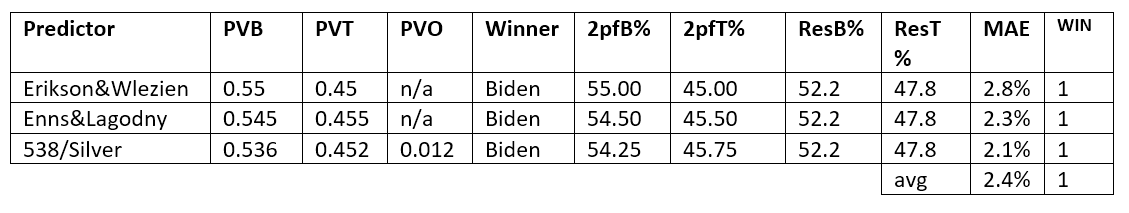
In terms of predicting a popular vote winner, our five selections were fairly reliable for popular vote, not so much for Electoral College votes. All of them except Norpoth predicted a Biden win. But most overestimated the size of Biden’s lead, except for Enns and Lagodny who underestimated his lead in the EC, and Norpoth who predicted a Biden loss.
In passing we note in sadness the failure of Norpoth’s Primary Model. It was a simple and hitherto robust model which uses the votes cast in the presidential primaries (the process parties go through to select their candidates months before the election). If, like Fair, he had recognised the vulnerability of his model to the pandemic he might have withdrawn it.
Modellers and other predictors: Statewide predictor aggregators
Previously we had neglected statewide predictors, specifically statewide opinion polls, because their lower frequency and asynchronicity make them difficult to use. Nevertheless, well-resourced analysts may spend a considerable period of time investigating them and produce their own aggregated predictions based on those polls or other elements. Unlike the predictions above, which were more measured and were published in political journals, these were more ad-hoc.
There are three statewide predictor aggregators that we can use and they are:
- FiveThirtyEight
- RealClearPolitics
- Sabato’s Crystal Ball
The selections were predictors of Electoral College vote. The resulting MAEs and WINs are in Table 5 below.
Table 5: Predictions of EC vote made by statewide predictor aggregators close to the 2020 presidential election. ECV = prediction of Electoral College vote; 2pf = prediction of the Electoral College vote on two-party-forced basis; Res = actual result on two-party basis; B = Biden; T = Trump; O = Other.
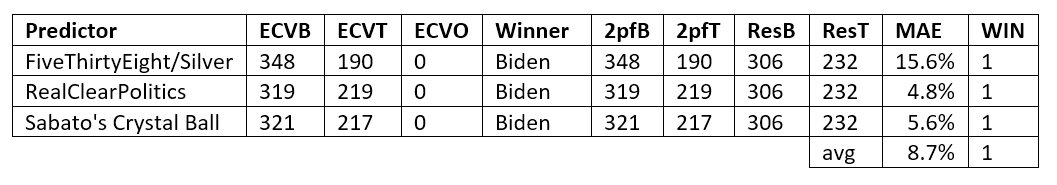
The MAEs for these are not exactly great, but they are better than the more formal journal predictions, and RealClearPolitics’s prediction was close to the actual outcome. But, again, all overestimated Biden’s lead.
Betting odds and spreads
The website Oddschecker lists 20 fixed-odds and 3 exchange bookmakers that accepted bets for the 2020 presidential election. Combined with Ladbrokes and Coral (who had left Oddschecker earlier in the year), that yielded 25 bookmakers.
To match our previous article on the 2016 election, we selected the following:
- Betfair Sportsbook: a London-based bookie that covers fixed-odds
- Betfair Exchange: the same London-based bookie that covers exchange betting
- Ladbrokes: a London-based bookie that covers fixed-odds
- William Hill: a London-based bookie that covers fixed-odds
- PaddyPower: a Dublin-based bookie that covered fixed-odds. Merged with Betfair in 2020
The bets pay out if the selection gains a projected majority in the Electoral College (and hence the Presidency), not if the selection wins the popular vote. Consequently, all of our selections were measuring the probability of winning the Electoral College. If we compare those probabilities to the result (Biden won) then the resulting MAEs and WINs are given in Table 6.
Table 6: Odds on EC win from fixed-odds and exchange bookmakers prior to the 2020 presidential election.
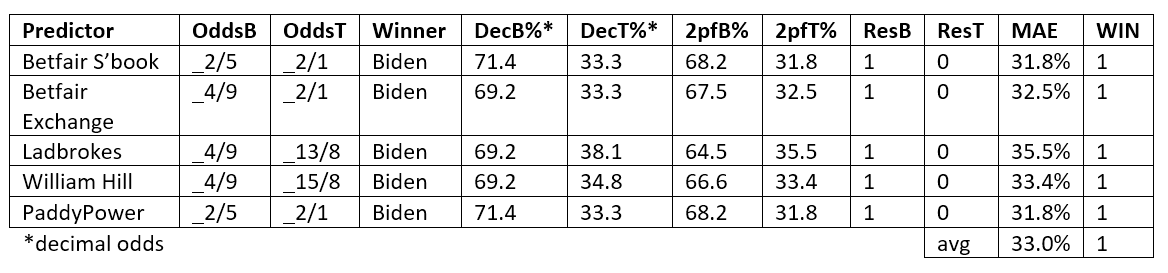
As is the case in previous elections, the odds have a very large MAE. But please note that odds are normally measured by calibration, and examining them by MAE is not the standard approach. However, that argument must be counterbalanced by the fact that if we wish to compare odds to other methods in this election, we must use a common comparator.
Again, the predictors predicted a Biden win.
Conclusion
Judging from the early commentary on election night and immediately after, the 2020 US presidential election was to be seen as another entry in the long line of prediction failures. These “hot takes” were further complicated by the heated debate surrounding the count of postal votes, which were unusually large in number due to the pandemic.
A report by the American Association for Public Opinion Research, published in July 2021, reinforces this impression with respect to polls, pronouncing them the worst in 40 years for the national popular vote.
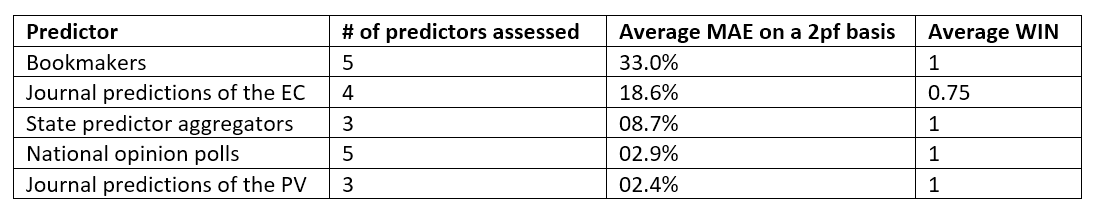
However, we note that the vast majority of predictors predicted a Biden win (see Table 7 for summary) and that the polling error was comparable to that of 1996. In normal circumstances this would not be enough. But, given the fact that the election was held in the middle of a pandemic, this must surely be considered adequate.
One fact is indisputable: the predictors – with only a few exceptions – overestimated Biden’s lead.
Table 7: Summary of predictors close to the 2020 presidential election.
This article measures how predictors performed, when compared to each other and (for the polls) when compared to previous elections. But this was an extraordinary election, and how the predictors were perceived, how they were judged and the implications for modellers, pollsters, political scientists and bookmakers as the events between Election Day 2020 and Inauguration Day 2021 unfolded are outside the scope of this article.
Consequently, they will be examined in the next entry in the “Forecast error” series.
About the author
Timothy Martyn Hill is a statistician who works in the private sector.
Disclaimer
To pass the compliance requirements of the author’s employer, please note that the author’s affiliation for this article is “independent” and the views expressed in this article are those of the author and in no way do they reflect the opinions of any entity or organisation with which the author is – or has in the past, or may in the future be – affiliated.
Editor’s note
A PDF version of this article, with in-line references and appendices, can be downloaded here.


